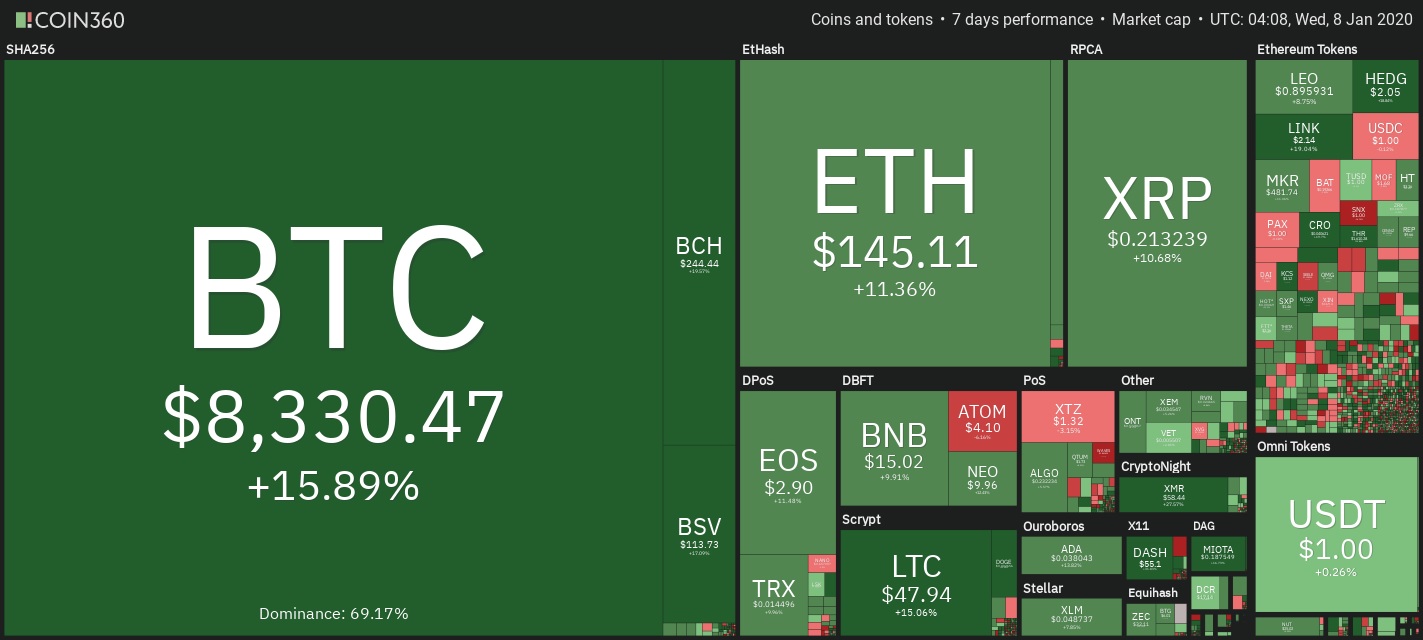
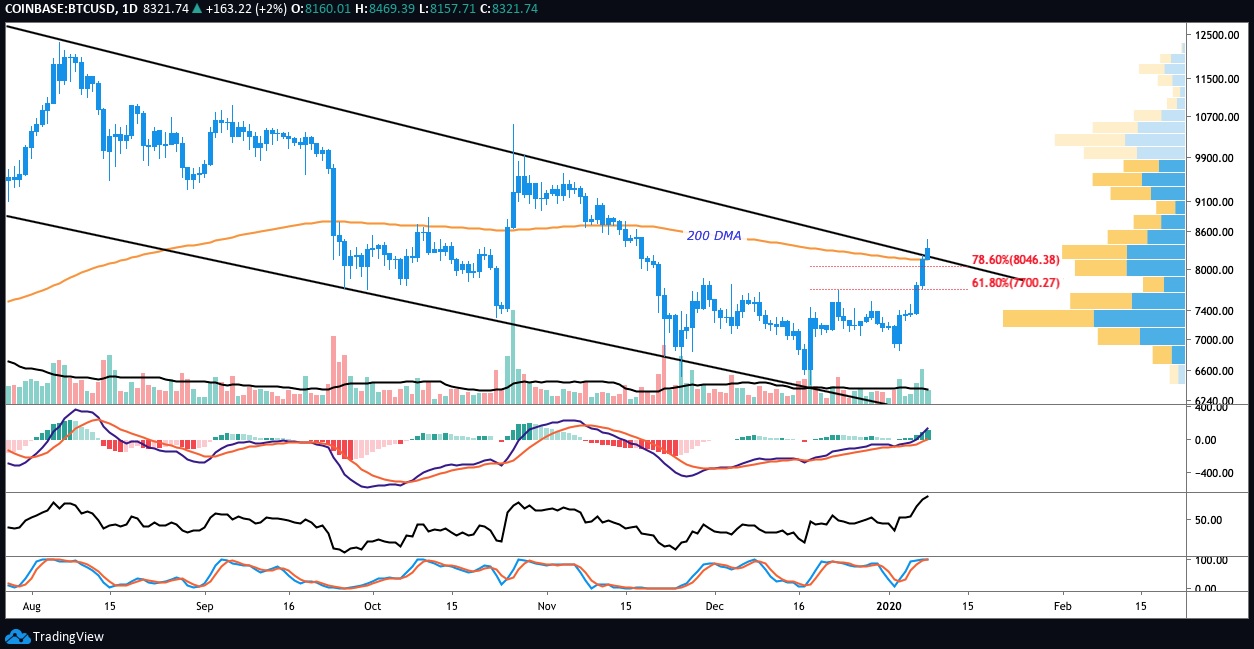
 Bitcoin has skyrocketed by over 6% in the past 24 hours to trade at $8,329 and effectively closing above the 200-day moving average for the first time in the past one year.
The uptrend also enabled the numero uno crypto to close above the long-term descending channel formed on June 25, 2019.
Notably, Bitcoin has been trading below the trend line since October 26 when Chinese President Xi Jinping advocated the country’s enterprises to quicken the development and incorporation of blockchain technology.
Crypto analysts trust that Bitcoin’s strong rally from $7,000 to roughly $8,500 has been primarily led by increasing strains between the US and Iran.
As a matter of fact, the latest move above $8,500 happened as mainstream media stated that Iran had hit the two US bases in Iraq.
Over a dozen missiles were launched on both bases, with no official reports of casualties so far. Gold, a safe haven asset, and oil prices have surged, with spot gold hitting a 6-year high of $1,603.20 and gold futures rallying 2% to $1,605.80.
Similarly, crude oil gained 4%, with WTI (West Texas Intermediate) crude futures surging to $65.65 and Brent crude rallying to $71.75 per barrel. As commodities such as gold, oil and silver gained, the Dow Jones Industrial Average futures plunged 343 points and the S&P and Nasdaq futures also reversed mildly.
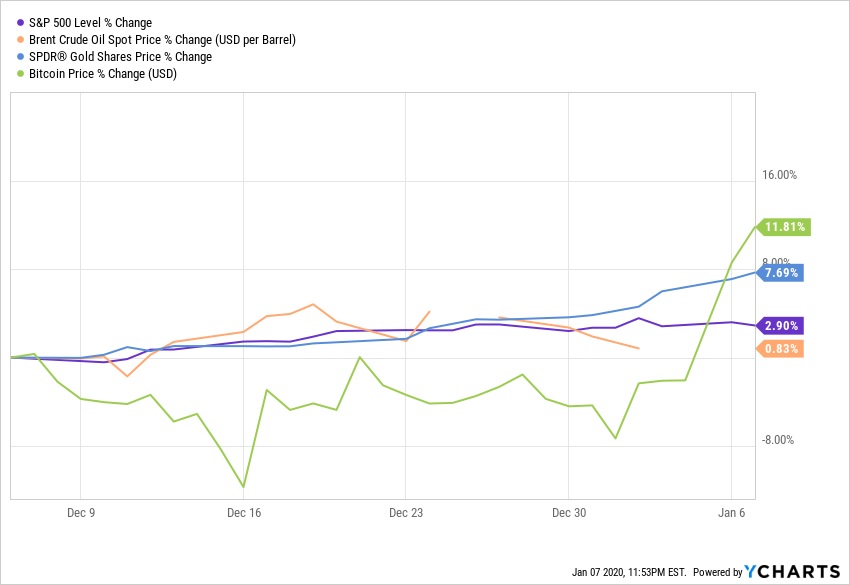
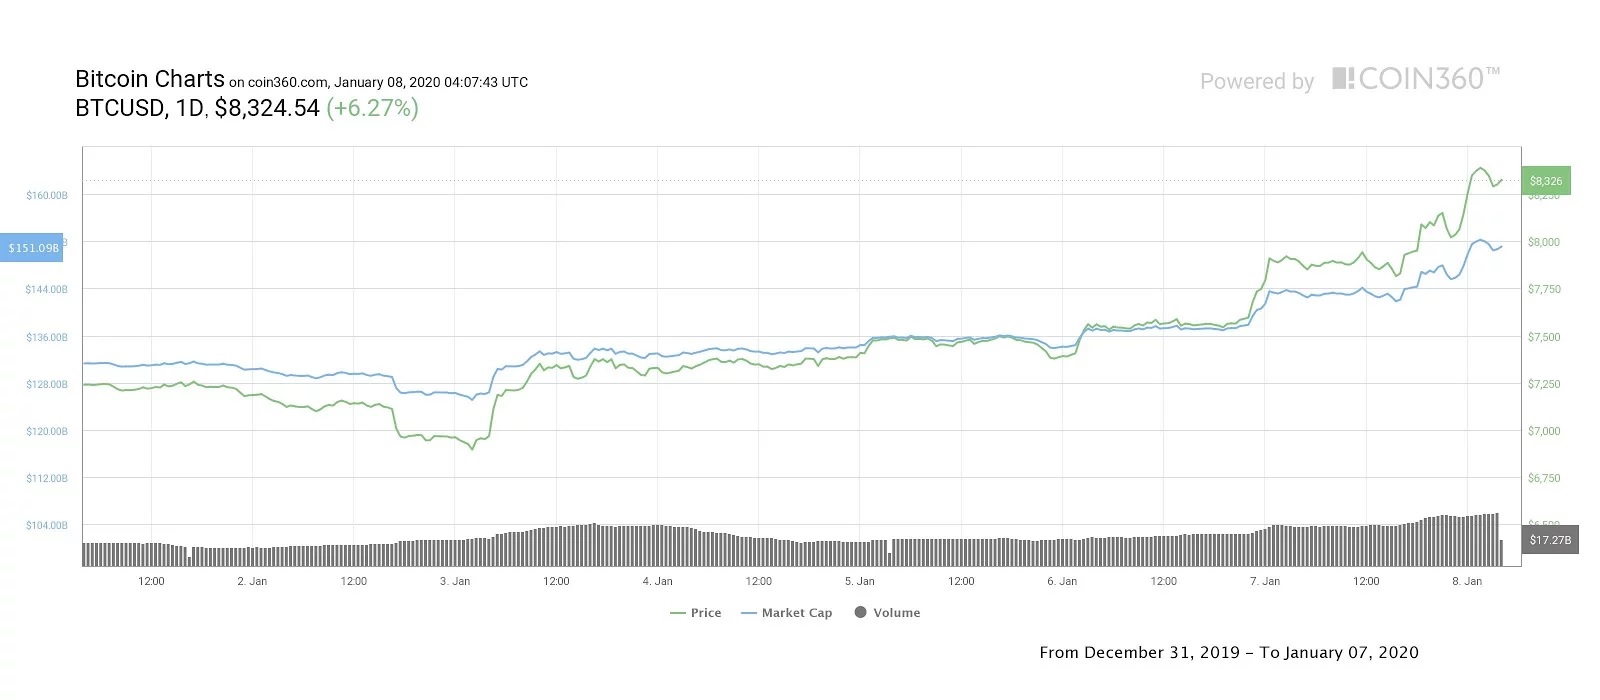
This indicates that traders anticipate the heightened tensions between the two nations will have a negative impact on conventional markets. Bitcoin’s surge along with assets such as oil, silver and gold is not a shocking development to several traders as many of them hope that the price of digital asset is correlated to the price of commodities.
Since January 6, price of Bitcoin has gained 15% and traders will be closely monitoring to know whether the asset can hold on to its gains and stay above the 200-day moving average and the descending channel.
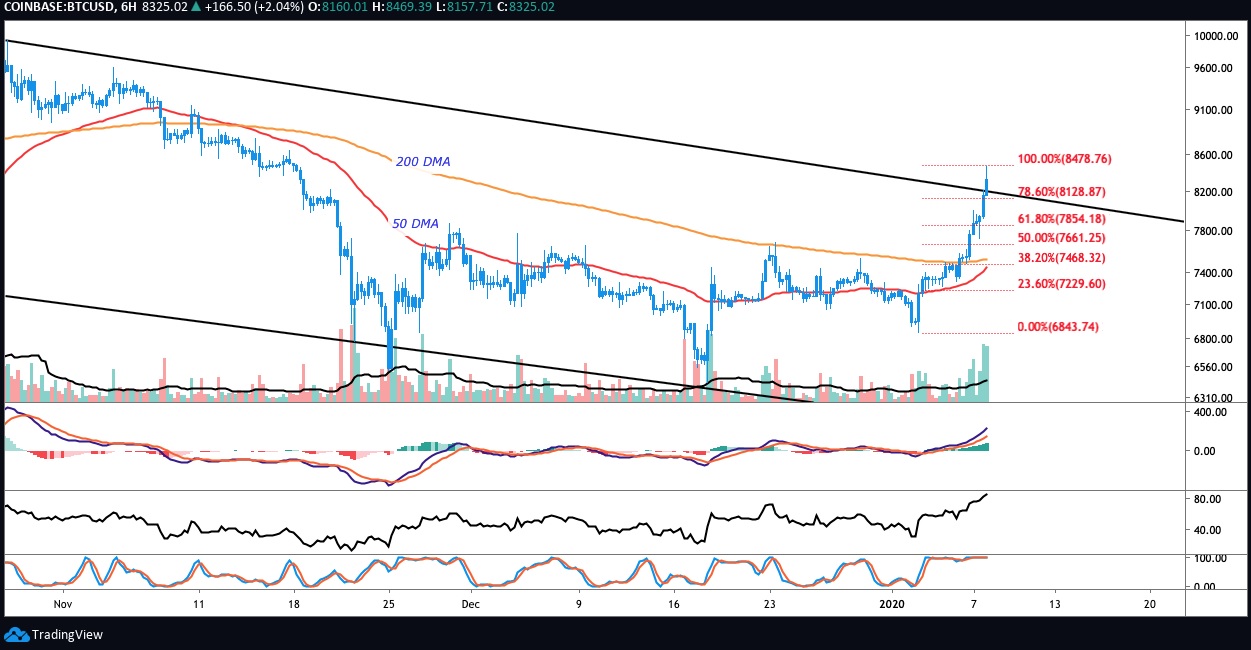
Regarding shorter timeframes, the price surge seems to be slightly over extended with the 6-hour relative strength index (RSI) moving above overbought zone at 84. Similar scenario is seen with Stochastic RSI indicator.
One optimistic outcome in the surge to $8,470 is that it permitted the price to cross above the $8,100 and $8,300 band where volume profile visible range (VPVR) exists. Many technical analysts believe that Bitcoin will undergo a price correction until $8,300 and then rebound again.
However, if the support at $8,300 is broken, then the crypto might touch $8,150, which represents the main support of the descending channel and around the 78.6% Fibonacci retracement level.
The total cryptocurrency market capitalization is $218.40 billion and Bitcoin’s dominance rate is 69.2%. ChainLink (LINK-$2.24) with a gain of 15.8% and NEM (XEM-$0.03525) with a gain of 5.8% are the two altcoins with impressive gains.


